
During the third quarter of 2015, a total of 1,502 records were updated with their 2014 revenues and employee counts. Along with these updates, 144 new records were added to the database and 41 records were deleted/removed from the active file. There are now a total of 4,622 active records in the database.
With this update, we developed a summary of the full database examining the revenue for The Global 5000 by industry and country. Industries are our regular industry classification scheme. The countries were the top 20 (by total revenue) and then the remaining countries summed to an ‘others’ total.
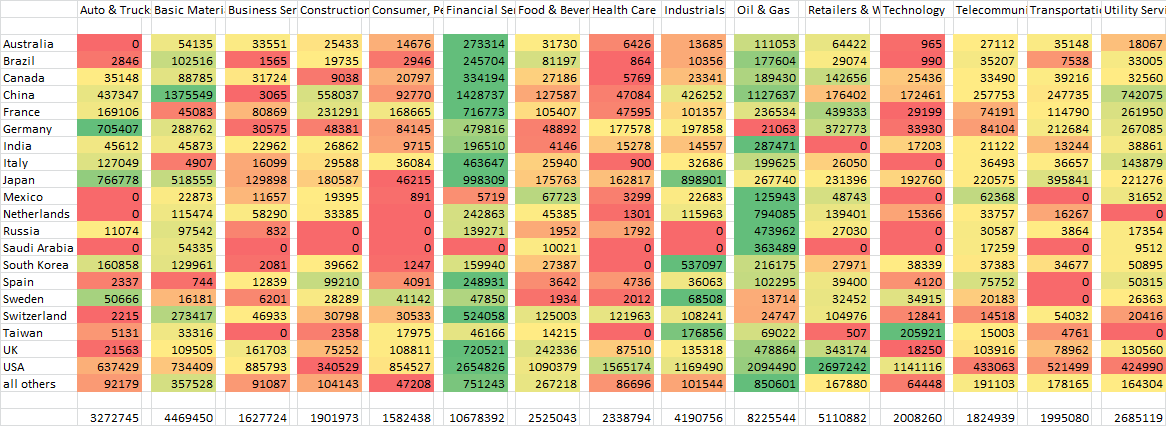
We then took that matrix and created a Heat Map shown below. The values in each cell are the total revenue for Global 5000 companies in that industry in that country. The color code here is that green is the highest total and fading down to red as the lowest. We built the map by coding each row/country to make it easy to see where the key industries are in each country.
Using this technique it is easy to see how much the financial and oil industries dominate. It also shows some other key markets – retail in the US, basic materials (commodities) in China and technology in Taiwan as examples.
In our next update we will create a heat map going the other way – by coding the industries to see what countries pop to the top.
For more information about The Global 5000 database – click here.