One of the interesting things about having a database that is consistent over time and updated regularly is that the data can be continually mined and trends can be tracked and measured over various periods. We find that to be useful in this B2B marketplace where many companies are talking/thinking about Account Based Marketing (ABM) and trying to move away from the mentality of pushing volumes of leads everywhere. Some strategic input can be useful.
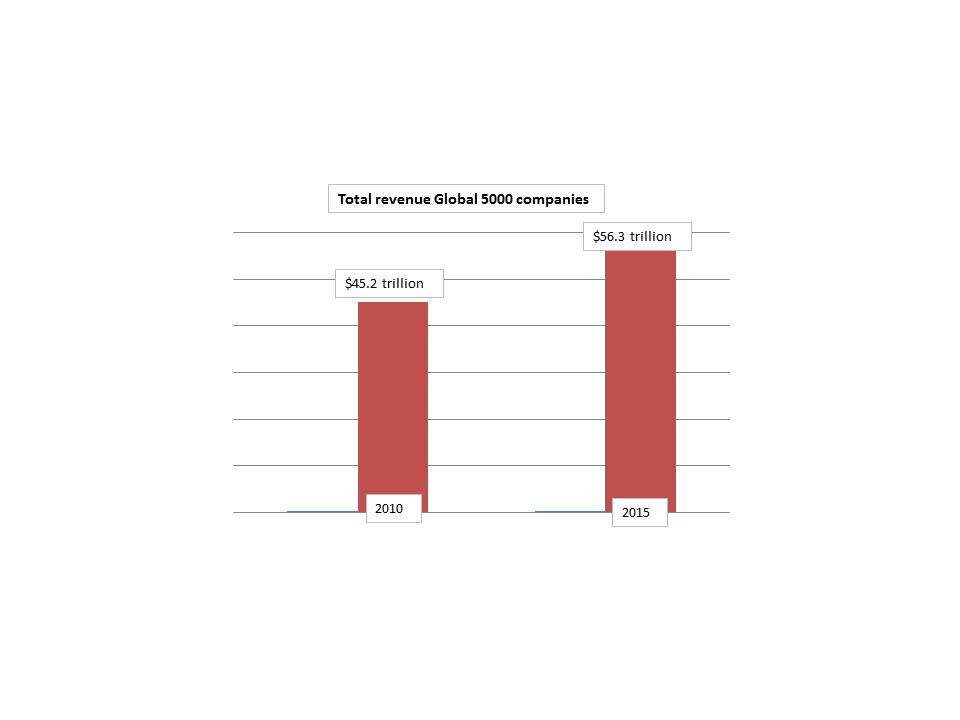
An example comes to mind when thinking about how various markets have changed in just the past few years. To illustrate the point, we took a look at the growth of the Global 5000 companies over the period from 2010 to 2015. In that period, the total revenue of Global 5000 companies grew from $45 trillion to $56 trillion – an average growth rate of 4.5% as shown on the chart below.
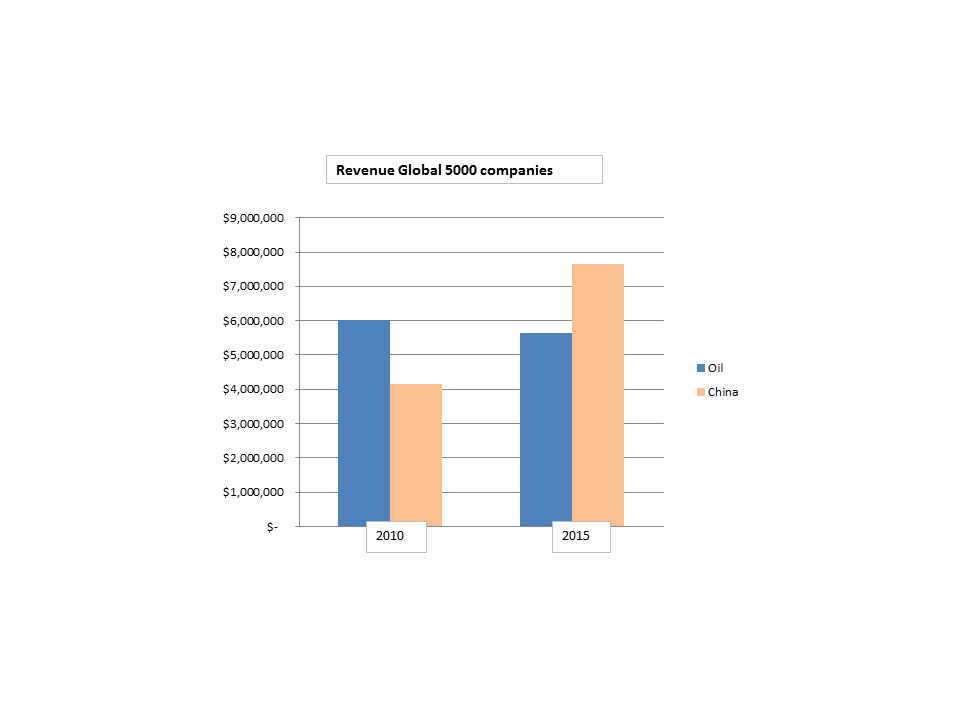
If your business was centered around Global 5000 companies during that period, you could expect a growth rate along those lines — in general. However, it depends on your focus. Look at chart #2 where we compare what happened to revenues from the oil industry (as one vertical) and revenues for China based firms as one geographic market. If your focus was on that one vertical, it has been a wold, bumpy and probably unpleasant ride. If you were able to work in the Chinese economy – a different story.
The bottom line here is that the trends are important and paying attention to the detail can pay off. Markets – even one as large and as stable as Global 5000 companies – don’t just automatically roll along each year.