One of the common uses for The Global 5000 database is in planning resources for global sales account teams. A recent client study helped show the way by planning resources to match the industry and geographic benchmarks of the overall market. To do this, we simply too the revenue of The Global 5000 – over $55 trillion and summarized the data first by region of the world and then by industry breakdown.
The theory here is that if your global account sales team is selling to the largest firms in the world your revenue split would (approximately) match these breakdowns.
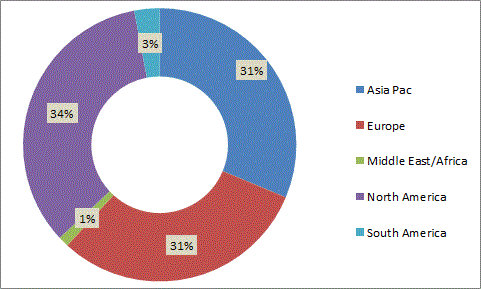
Starting with a geographic look, the markets breakdown with North America, Europe and Asia Pac about equal with just over 30% of global revenue in each with just small slices in South America and Africa/Middle East.
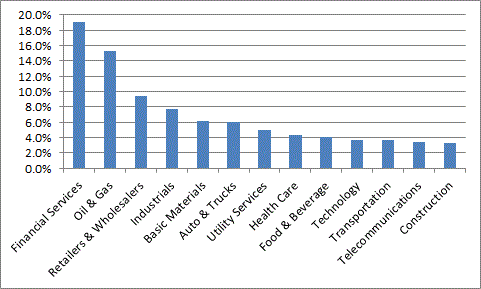
Now, let’s take that same set of Global 5000 companies and look at the revenue by major industries and we see a heavy influence of Financial institutions followed by Oil & Gas and the retail sector down to construction at 3.3%.
Again, your results may not look the same depending on what products & solutions you are selling and accounts you are focused on – but if you are looking to line up resources in the same manner as the overall market, this would be a reasonable target.
Two notes here:
- This data is summed based on revenue of the companies, not by accounts so it is weighted by the larger revenue players. The implication here is that if your organization measures account penetration, the splits by geography and revenue will be slightly different.
- Not included in The Global 5000 companies are government agencies and educational institutions so, if your account base includes coverage of those, the data will need to be adjusted to match to this set of benchmarks.
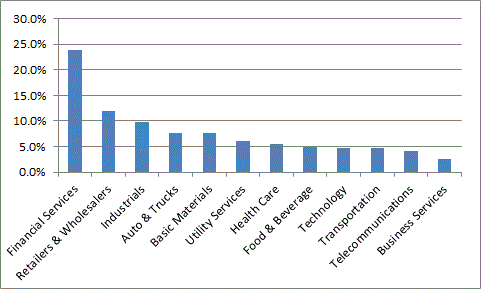
Let’s take a look at a specific scenario where we have modified the geographic and industry splits to reflect a specific country coverage. In this case, the global account team does not sell in Mexico or in Russia and they do not have products for the Construction, Mining and Oil industries. Therefore, we simply eliminated companies in those regions and industries and come up with the following benchmarks.
Under this scenario, we see the North American region represents a larger portion of the total market while Europe would be slightly less. Looking at the industry splits, the big difference is the increased emphasis on the financial sector while most other industries lined up in the same order.
The bottom line to all this is that the markets will vary slightly based on each individuals company’s product set and historical pattern – but having a sense of where the overall market is provides a sound directional benchmark.


