In the current global market environment as we begin 2016, there is concern over the slumping price of oil, a slower growth rate in China and the end of the stock market ‘bull’ cycle — among other concerns. The corporate markets have seen a flood of money fueling new companies (primarily tech and health care) followed by the IPO spurt and now consolidation among the big players.
All this comes as we have progressed thru a great bounce back recovery in the 2009-2010 period.
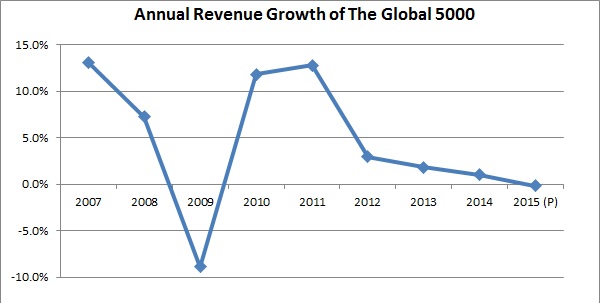
In many ways, as the big players go, so go the economy overall. You can see the dramatic change in the chart below showing the year on year total revenue change of The Global 5000 companies. Data for 2015 is preliminary in that we have the first 500 companies to report for the current year – so when all is final the 2015 data may be up a little or down a little.
 Starting in 2007, the global economy started to slip. 2008 and 2009 were clearly a shock and the big corporates were not spared as their revenue went into a deep slide. But, they rebounded well and had 2 years of double digit growth. This translates to multiple TRILLIONS of dollars going to the top 5000 companies in the world.
That kind of growth can’t last. Economies don’t expand forever – hence we see the continuing slowing growth trend over the past 5 years.
For B2B sales and marketers planning for increased sales every year, it becomes clear that the dollars you are looking for will have to come at the expense of others — other programs or competitors. It will not come from natural growth. It will not come from ‘boom time’ growth like 2010 and 2011. Obviously it pays to know the details of that growth by country and by industry. It is not universal, across the board.
As a footnote, as we write this post, IBM just announced their Q4 2015 numbers and it was noted this was the 15th consecutive quarter where revenues declined – emphasizing the trend we have been watching.
