Over the years, we have seen the growth of China’s global footprint everywhere – and it is no more evident than what we see in their large corporations and financial muscle.
Diving into our history data for the Global 5000 companies shows that pattern. We can go back to 2012 and look at the China based companies in The Global 5000 and track them thru year end 2021 revenue reporting. 2022 results are not yet reported.
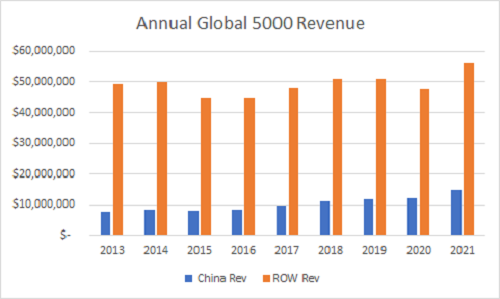
Back in 2012, there were 420 China based companies in the Global 5000. Today, that number has grown to 560. Revenues for all 5,000 companies totals overs $70 trillion with China counting for nearly $15 trillion – 20% – of that as the chart below shows. Given the state-driven nature of these large organizations it is not surprising to see that they represent only 10% of the companies but 20% of the revenue.
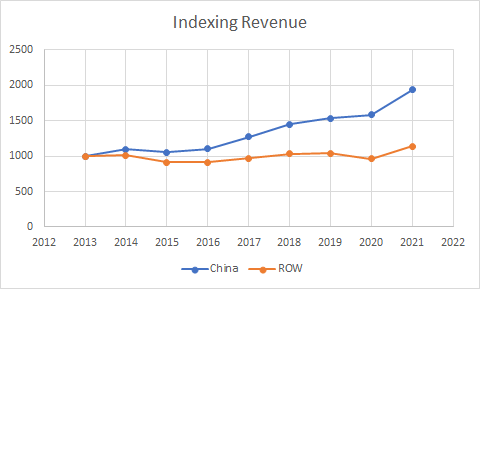
Another way to look at China’s growth over time is to use an index approach to show the revenue growth over the years. Here we set the total revenue for China based companies in 2012 to a value of 1000. And did the same for the ROW (Rest Of the World) companies. Thier combined revenue was also set to 1000. Then we calculated the % growth each year thru 2021. Here we can see the remarkable growth of companies from China compared to those in the rest of the world. We get to see how that major engine is charging forward. Pretty remarkable.