
In the everyday stream of business news we read about all the economic ups and downs usually intertwined with political or government policy action/inaction. Whether it be recession related, Brexit news, OPEC actions, trade wars or any number of factors, the constant drumbeat makes it hard to see the bigger waves of change.
As we have been building and conducting ongoing updates to the Global 5000 database, the growing presence of China has become evident. It is now the 2nd largest economy in the world and the number of Chinese based companies in our database also ranks second to the USA.
In order to understand the magnitude of the Chinese market and its footprint we took an extract of the data and did a little analysis. We took the revenues Global 5000 companies in 6 largest countries – USA, China, Japan, UK, France & Germany – (3,480 in total) over a period of years and looked at their growth rates.
We started with 2009 which is generally accepted to be when the last big recession bottomed out and the economy started to turn toward the end of that year. From that point we gathered the annual revenues for each year for these Global 5000 companies and calculated their annual growth rate/rate of change — shown in this chart.
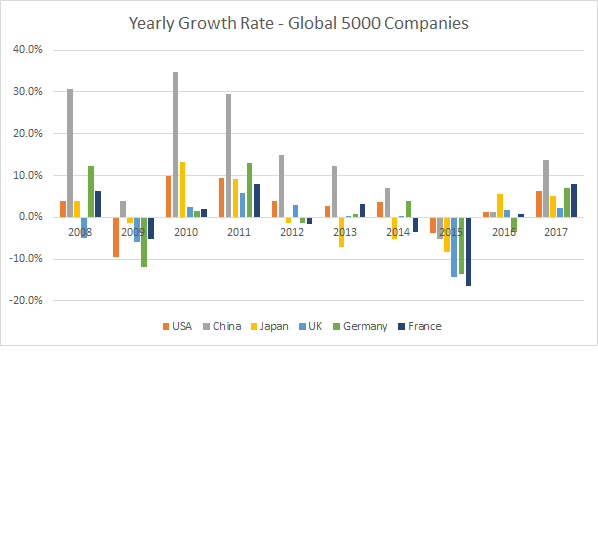
You can see where 2008 revenues for these large firms was fine and everything went downhill in 2009 and then recovery growth in 2010 and 2011. China really took off in those years, partly due to the growth around the world but also to the emphasis placed on economic growth by the government. Then things turned modest until the plunge in basic materials and oil rocked the company revenues in 2015. The US election & UK’s Brexit vote also factored into the mix here as well. It was 2017 (the last year we had full revenue reporting) when things got strong again.
All along, China shows significantly different growth, the US shows moderate growth and companies located in the other 4 countries lag.
To really emphasize the market shift we did an index using these growth rates, Starting in 2009, we began an index for each country starting with a value of 1000. Then grew that index value by the growth rates shown on the chart above. The result after 8 years ending in 2017 looks like this:
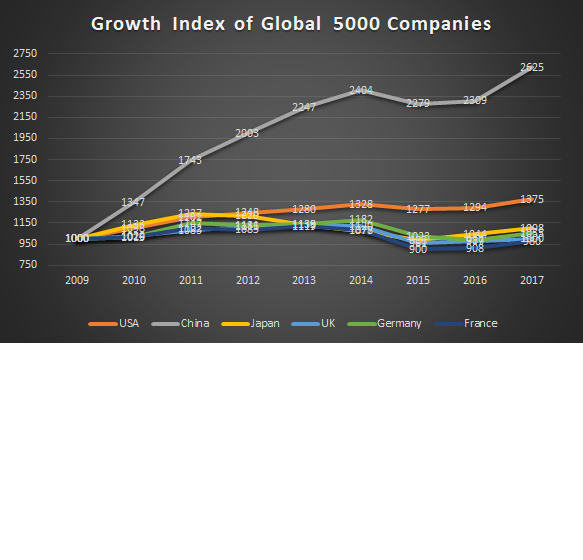
Here you can see the cumulative effect where revenue for the largest companies in China now double those from Japan, UK, Germany or France. Powerful.
One major impact with this data relates to market planning and sales objectives. Most market data is based on using either US numbers or WorldWide numbers. If WW, it is quite likely that the expected distribution of those numbers by country or region does not match this new reality – the result being China will likely be understated, the other countries/regions/geographies will be counted on for more/higher results and the goals will go unmet.
The market landscape across the globe for nearly every vertical market & product has changed significantly and continues to evolve rapidly. With new world realities given issues like trade wars and Brexit actions – more change is inevitable.