
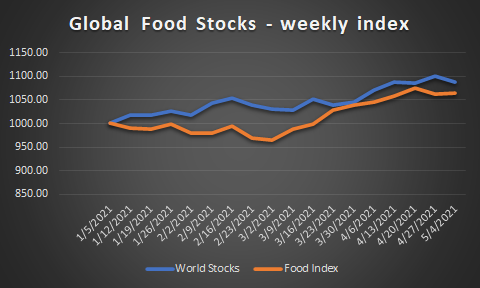
The chart below shows data from a newly created index for the Food & Beverage industry — and compares the stock prices of industry leaders to the overall world stock prices (shown on blue line).
Index data was captured from a specific day each week so the chart shows the weekly close and changes. As you can see from the chart, the food industry leaders are lagging the overall market.
Here’s the details re: how the data is compiled.
The world Stock index is the easy part — MSCI produces the global index.
For the Food Index, we took the largest 12 Food & Beverage companies in the Global 5000 and set their stock price to 1000 for the first week in January 2021. Then every week we calculated the % change for each stock and kept the index going each week. This is a weighted index where the weight is based on the market share (revenue size) for the 12 selected companies. In essence the largest of these firms (Nestle) has the most weight in the index.
The 12 companies in the index are:
- Nestle SA
- Philip Morris International
- PepsiCo
- Unilever Group
- Anheuser-Busch InBev
- JBS S.A.
- Tyson Foods
- Imperial Brands
- Coca-Cola Company
- British American Tobacco
- Mondelez International
- Danone