So far this year we seem to be in a news cycle hearing of an economy going sideways with continuing questions of growth along with an oil industry constantly in the news. It is easy to see how this has developed by digging into the details of the Global 5000 database.
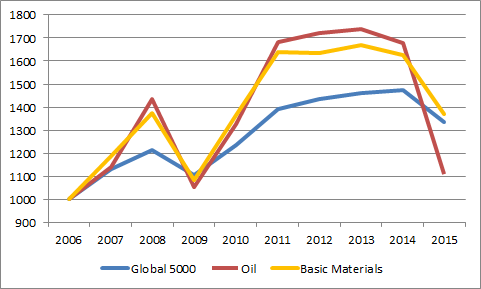
Take a look at the chart below here. We took the collective revenue from the Global 5000 companies in total starting back in 2006 thru 2015 and plotted it with the blue line and compared it to the oil industry (red) and the basic materials (yes) which include metals, mining and chemicals among others.
In all cases, we see the downturn in 2008/2009 when the recession hit followed by the bounce back growth in the following years. From 2011 thru 2014 markets have been fairly flat with slow growth. Now, with 2015 in the books we see the dramatic drop off in revenue where these basic industries and oil are dragging the overall business down. The boom in these 2 industries and the subsequent fall are both dramatic extremes on both the upside and downside.
- To put 2015 in perspective, the revenue of the Global 5000 was down over 9%
- Oil companies saw revenue shrink by 33%
- For Basic Materials, it was a decrease of 15%
Dramatic numbers for sure. No wonder stock markets are sideways and global growth concerns are on the tip of everyone’s (virtual) tongue these days.
Now, take this info over to your sales & account territiry planning. With revenue challenges like these, those clients and prospects will be challenged to spend what you are planning (hoping?) they will spend.