
The economic hit from COVID has been significant for many business segments and they will undoubtedly be slow to come back while others found news ways that were forced on them thru these circumstances. Economic cycles are not new. They are all different, but always appear.
These cycles can be seen by looking at the Global 5000 companies over a few years as these large companies represent such a significant portion of the global economy. In fact, the collective revenue of the Global 5000 companies represents over 2/3 of global GDP. It is a true case of following the money.
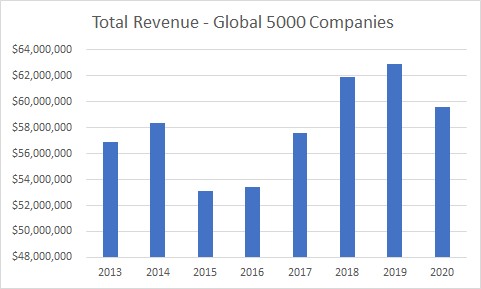
Take a look at the first chart showing the total revenue of the Global 5000 companies over the years. The growth and consolidation of the “big guys” continues to drive upward . until overall global forces strike. In 2015, it was a global slowdown where the industrial sector stalled, oil prices fell and emerging economies had little to no growth. That all conspired to cause a disruption just like COVID cause the disruption to 2020 revenues. ($$$ expressed are in trillions)
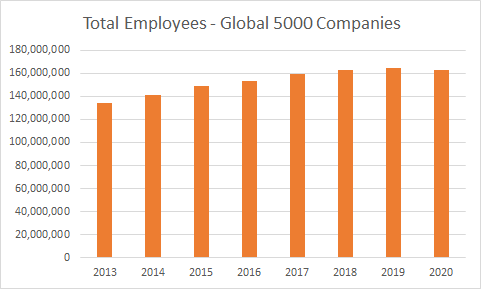
The second chart shows the total employment of Global 5000 companies and that is almost a continual climb – until 2020. This data trend will be real interesting to watch when both 2021 and 2022 data is reported given the market concerns over tight labor pools.
As always, we appreciate your support and encourage your input and questions regarding the Global 5000 database.