One question we get asked regularly is — what does it take to make it into the Global 5000?
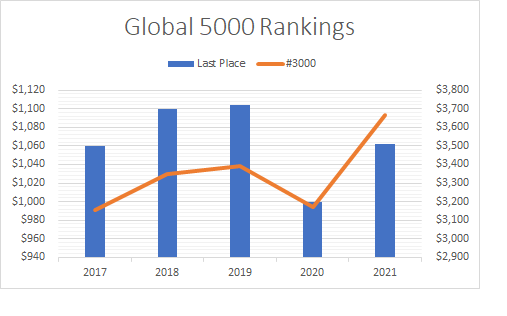
The Global 5000 is based on revenue and for most years, the bottom level of revenue is just above $1 billion in annual revenue. Take a look at the chart below – the blue bars using the left axis – show the revenue for company # 5000 for each of the past 5 years. It was rising until Covid upset everything in 2020 and now it is rising again — but always close to the $1 billion level
Another interesting measure for the Global 5000 company size is to look at a measure in the middle. We chose to look at the company in the #3000 position – just a bit lower than the middle to see how that level has changed over the years. Data for this level is reflected in the orange line and the right-hand axis.
Looking at this data and watching the company action over the years you can see how the biggest companies just keep getting larger. They buy out the smaller firms. M&A activity is a constant in the market and across most industries.
Smaller companies get into a growth mode and then get acquired. Very few go from small and make it big. Many in the high tech sector did it – but it takes some interesting confluence of events.